That Open Platform’s Release 3.3.0, presented as “From BIM Data to BIM Insight”, focused on making model information easier to query, visualise, and act on. Instead of sending BIM data through generic dashboard tools and custom pipelines, the release introduced chart Web Components intended to work directly in BIM applications.
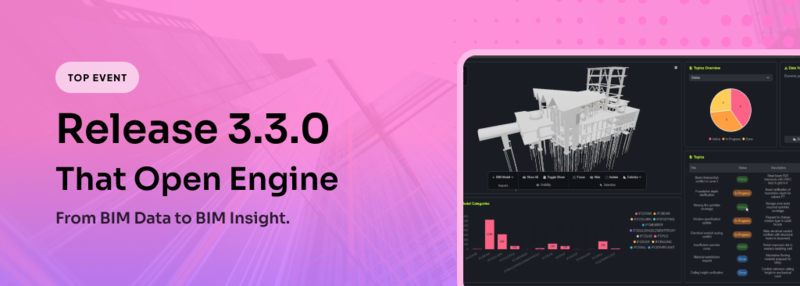
The release covered area, bar, bubble, pie, line, polar, radar, and scatter charts, along with BIM-specific chart components for attributes, categories, IDS results, and BCF topics. The event also demonstrated filtering, highlighting, chart-to-chart linking, chart-to-table linking, asynchronous loading, and styling workflows, backed by new tutorials for applying the components in real projects.
This matters because a lot of openBIM work stops at access: opening a model, reading properties, or validating a file. Analytics components move the discussion toward feedback loops inside the tools themselves, where model quality, issues, compliance checks, and project signals can be exposed without leaving the application. That makes Release 3.3.0 especially relevant to teams building dashboards, QA workflows, or model intelligence tools on open web technology.